Most of these pieces stand on their own. This one shows how I build: a question from one course project became a metric in the next, got rigorously stress-tested in a third, and ended up on stage at HighEdWeb as a better way to measure owned social.
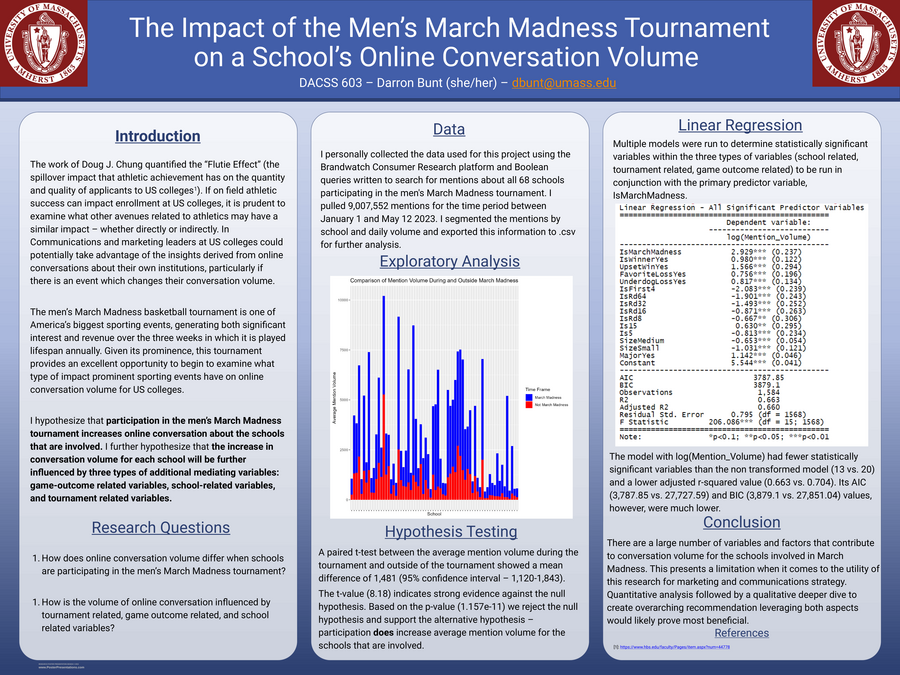
① The spark — March Madness
It started with a question about conversation volume: does a school's online conversation spike when its team is in the men's March Madness tournament — and how much of that swing is driven by factors outside the school's control, like the tournament itself, game outcomes, and school characteristics? The answer planted the seed for everything after it: what a school "gets" on social isn't only about what it does.
② The metric — Adjusted Average Post Reach
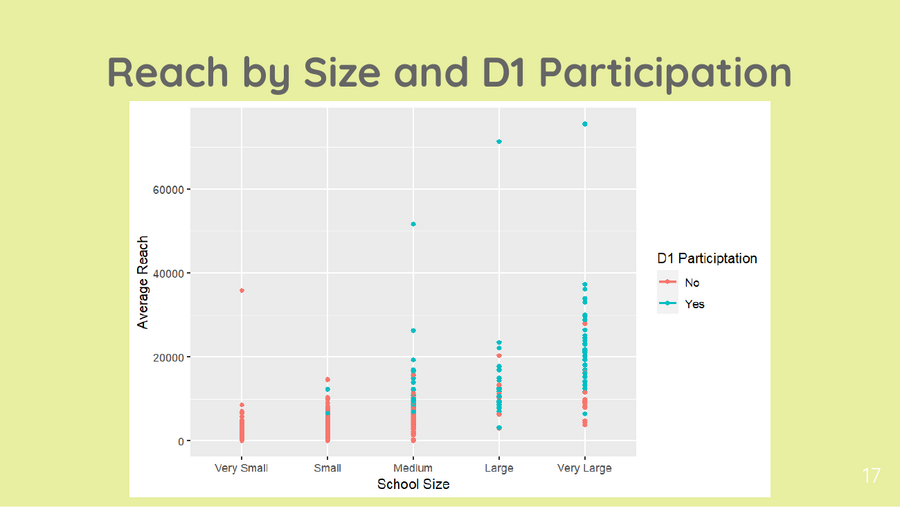
That seed became a metric. Using Brandwatch data across hundreds of US institutions, I modeled which factors outside a school's control shape the reach of its posts — size, athletics and division, control, land-grant status, and standing as an HBCU, HSI, or MSI — to build Adjusted Average Post Reach: a way to compare schools of wildly different sizes on a level playing field, separating what a school earns from what its size simply hands it.
③ The refinement — expanding the model
In a machine-learning course, I took the original 604 model (lm_604) and pushed it — expanding the variable set, resolving singularities, and testing it against all-variable and best-subset models to see how far the prediction could be taken. The metric got more rigorous, and I mapped where its limits were.
④ The stage — Chasing Likes, HighEdWeb 2023
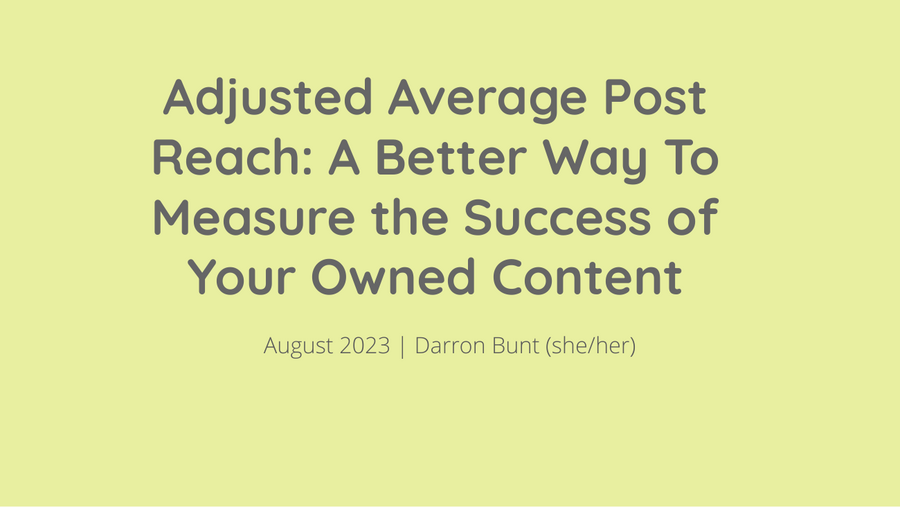
Then the whole line of work went public. At HighEdWeb's 2023 Analytics Summit, I presented Adjusted Average Post Reach to a room of higher-ed marketers — built on 538 colleges and roughly 80,000 posts — as a better way to measure the success of owned content than chasing likes. The research had become a method the field could actually use.
This is where my approach to measuring owned social comes from — not a best-practice slide, but one idea carried from a course question, through three courses of refinement, and onto a conference stage.