The brief you'd otherwise build by hand across a dozen tabs — enrollment, selectivity, cost, classifications, and demographics — pulled from federal data into one readable screen.
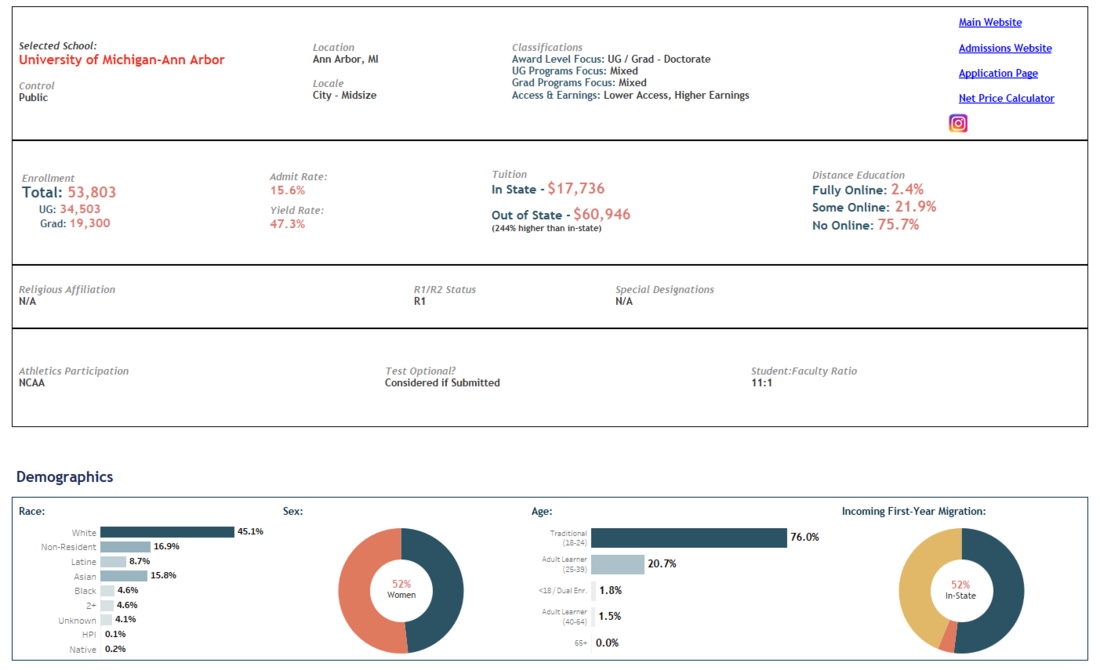
A Tableau institutional snapshot: enrollment, admit and yield rates, tuition, classifications, and a demographic breakdown — the at-a-glance profile that usually takes hours to assemble, on a single screen.
The brief you'd otherwise build by hand across a dozen tabs — enrollment, selectivity, cost, classifications, and demographics — pulled from federal data into one readable screen.