Tap or click the image to open full size · Download the PDF
Benchmarking the emails US colleges send to prospective students.
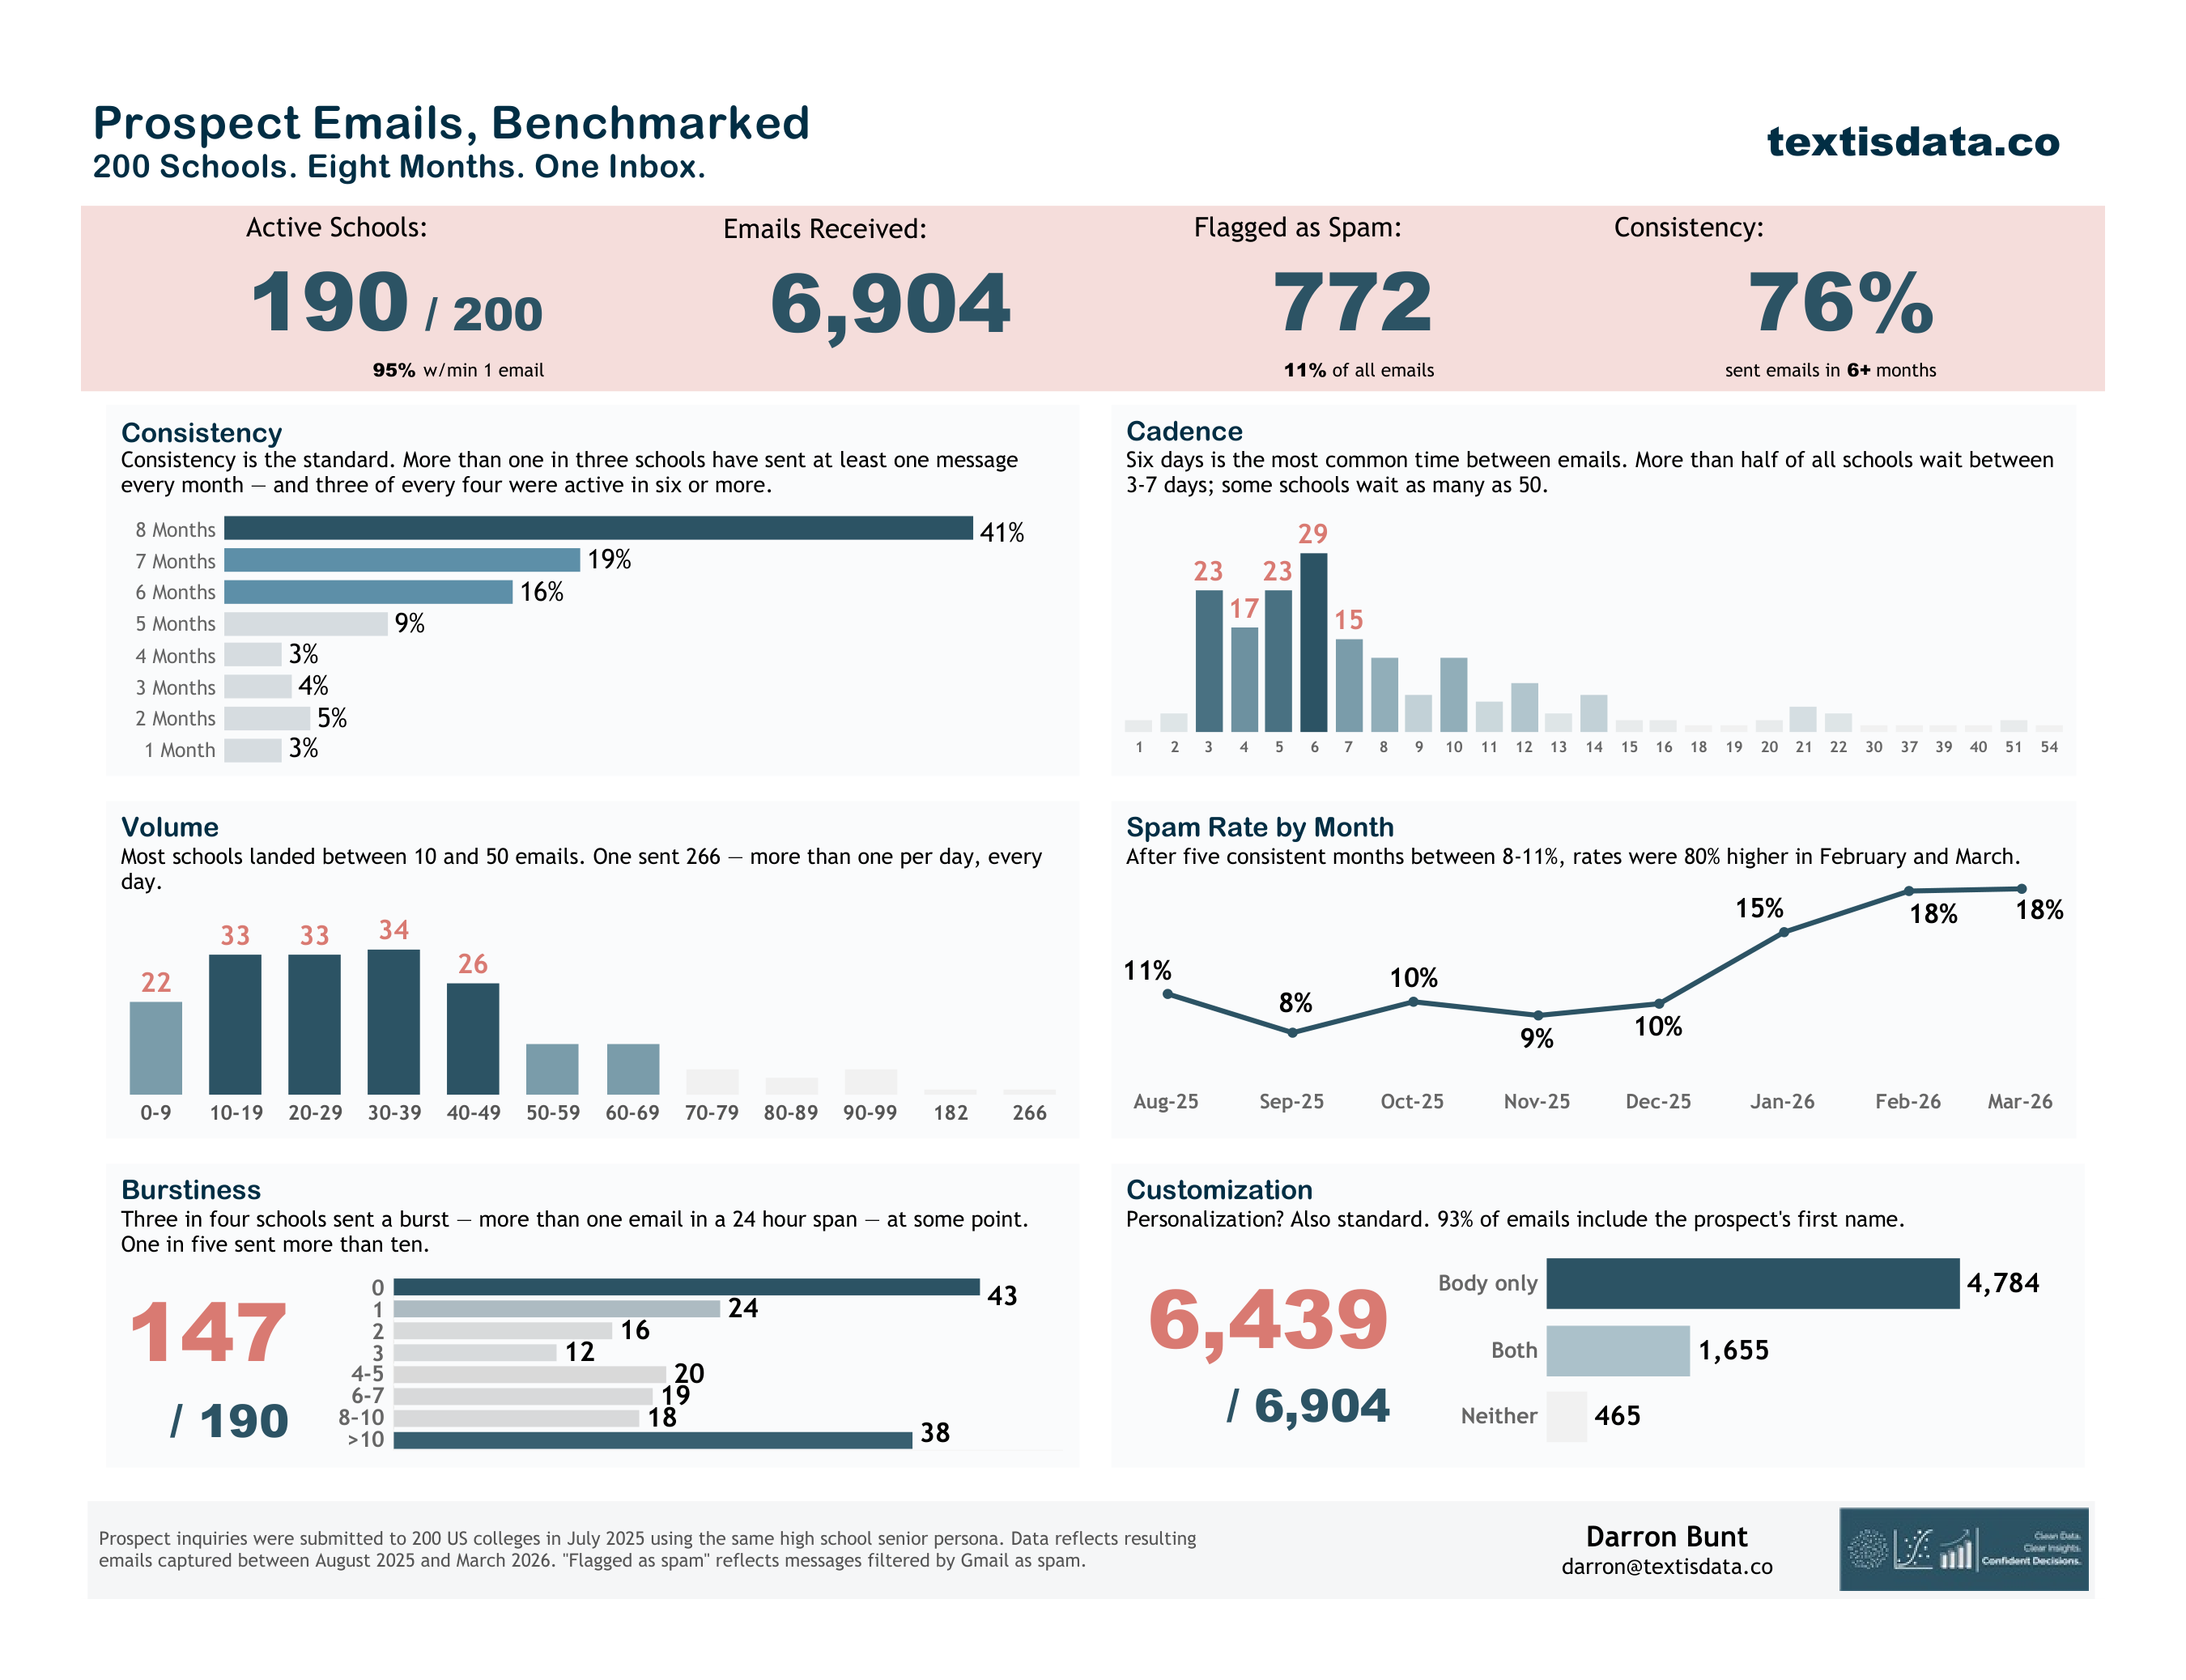
Nearly 7,000 emails from 200 schools, all landing in one inbox — classified, counted, and compared to show what the prospective student experience actually looks like.
Tap or click the image to open full size · Download the PDF
Prospect inquiries were submitted to 200 US colleges in July 2025 using the same high school senior persona (all demographic info — geography, GPA, intended major, etc. — held constant). All resulting emails were collected, segmented, and classified.
The benchmarks reflect emails sent between August 2025 and March 2026. "Flagged as spam" reflects messages filtered by Gmail as spam.
The benchmarks make up one view. Your school is another. Reading your own prospect communications through the same lens is the work behind the Prospect Communication Intelligence framework — the narrative, the sequencing, and the market context, read together.
If that's a conversation worth having, I'd love to start it.